 A quick tour
RP3W is a lightweight and easy tool for recording rowing sessions on the ROWPERFECT3 rowing simulator. Data recorded and stored can at a later moment be reviewed for analysis. Files stored with RP3W is fully compatible with SEAN : Session Analysis, convenient for those who want to do more with their data.
Back to top
Record a training session : Row window
To record a training session, start by connecting the RP3 USB interface to the computer. Next, run RP3W by selection the appropriate item from the Start menu or on the Desktop.In the New row window dialogue, enter the correct values for Name, Weight, Boat type and Sprocket or accept the defaults. To open a previously stored User File, click the button, locate the correct file and open it. When done, click .
The Row window appears, consisting of 3 major areas: the Force curve chart in top left-hand corner, the Stroke data chart in the top right-hand corner, the Data area at the bottom of the window, containing 8 cells, each containing either a parameter value or the RP3 logo.
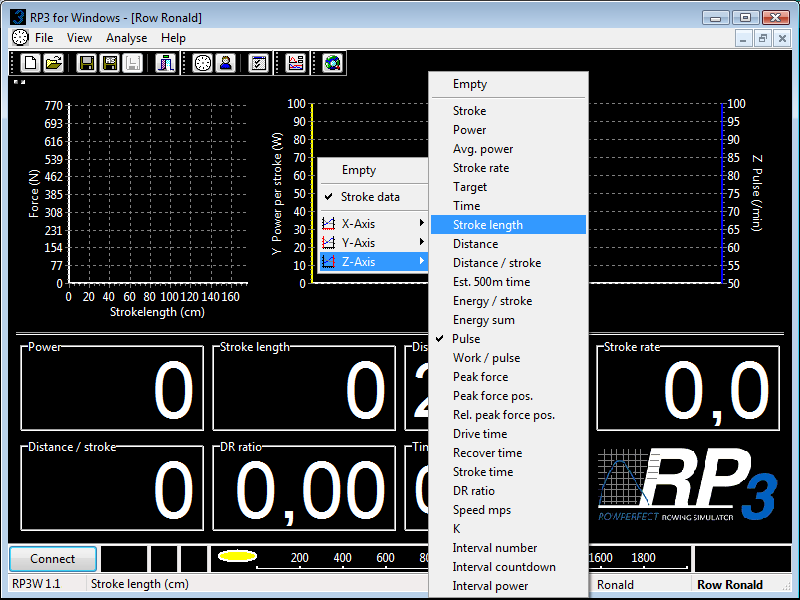
All these areas can be configured by right-clicking on them. An example of this is shown in the image below, where the Zaxis (the one on the right-hand side, default coloured blue) of the chart is changed from displaying "Pulse" (heartbeat) to "Stroke length".
Click the button or press the bar to connect to the RP3 USB interface and start rowing. When done, a dialogue is presented with your workout results.
Back to top
Review a training session : Session window
To analyse a training session, select the Open option from the File menu, press + or click the Open button on the toolbar. The Training window appears, showing the workout settings and the session summary. Next, select the Session option from the Analyse menu, or click the Session button on the toolbar, to display the Session window.The Session window consists of 4 major areas: the Force curve chart in the top left-hand corner, the Data area in the top right-hand corner, containing 12 cells, each containing either a parameter value or the RP3 logo, the Stroke data chart at the bottom left of the window, the Summary area in the lower right-hand corner, containing 3 cells.
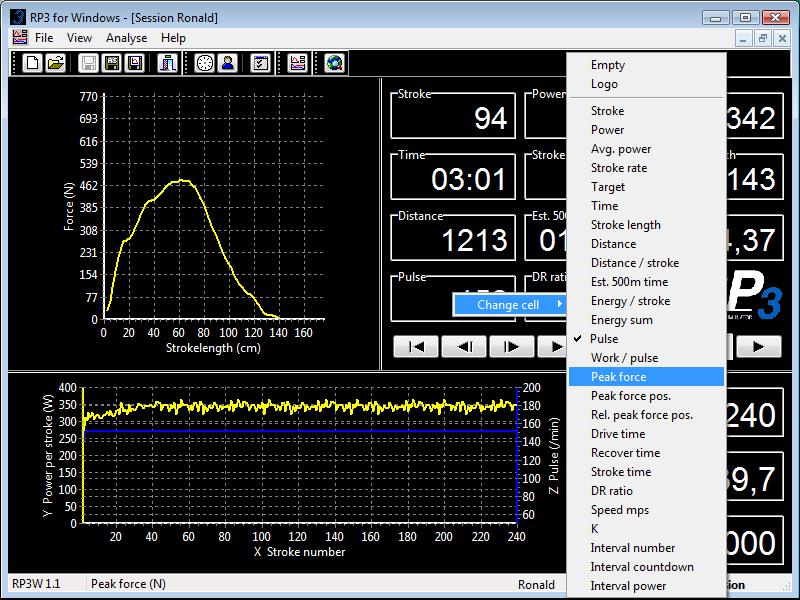
As in the Row window, these areas (except for the Force curve chart) can be configured by right-clicking on them. To zoom-in on any of the charts, draw a rectangle by pressing and holding down the left mouse button, and moving the mouse to the right as well as the bottom. Let go of the mouse button to see the selected part of the chart in more detail. To restore to the original zoom factor, do the same in the opposite direction (bottom-right to top-left). In both the Row window as well as the Session window, the horizontal line splitting the window can be moved by dragging it up or down. Charts and parameter cells are automatically scaled. Below the Data area, 5 VCR style buttons and a scroll-bar can be found. These buttons are used to navigate through the strokes in the training session file, updating the upper half of the window continuously.
Back to top